De-spaghettification
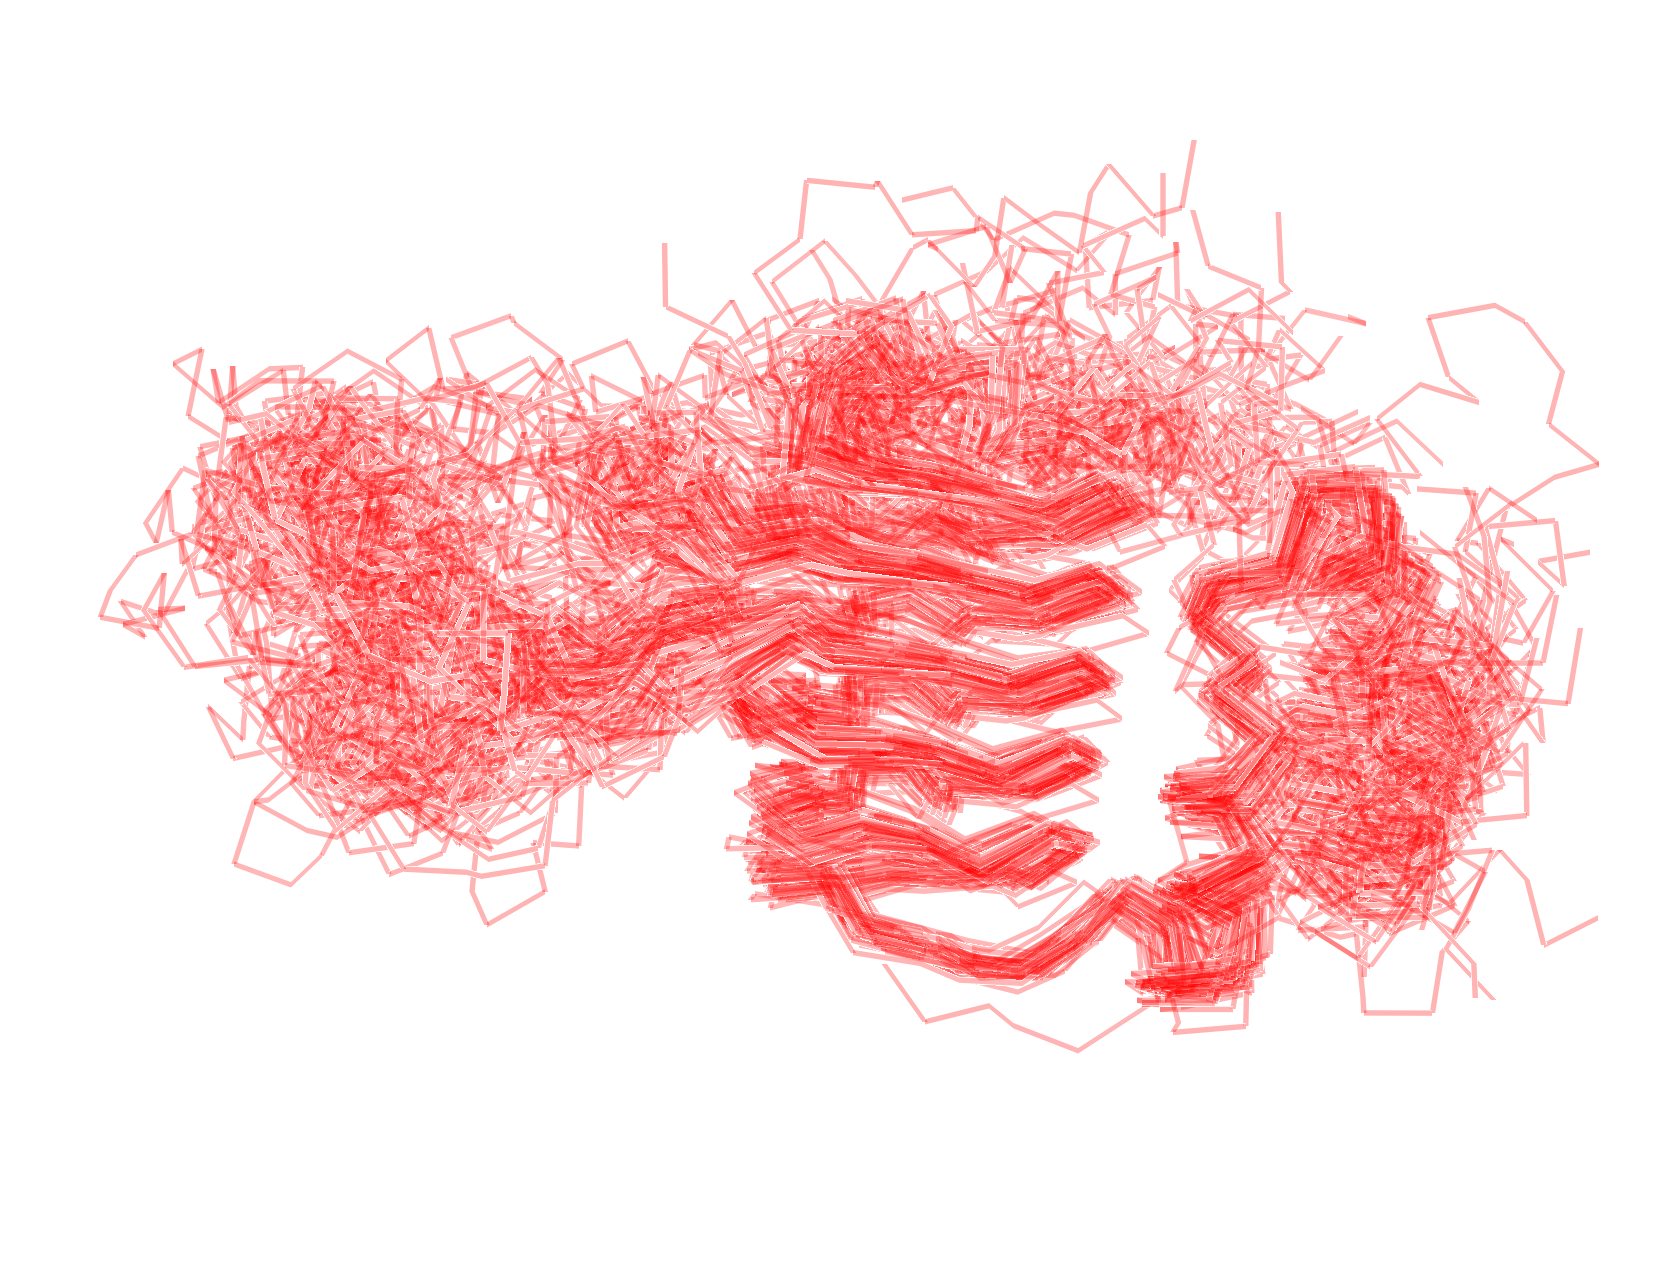
Suppose you have, for whatever reason, a bunch of structures that you want to compare. If you have a couple, it’s easy enough to just look at them. What if you have a dozen? Or a thousand? Things become a bit harder. Take this, for example: here, I aligned about 100 various homologous proteins to a reference structure. It’s a bit of a mess.

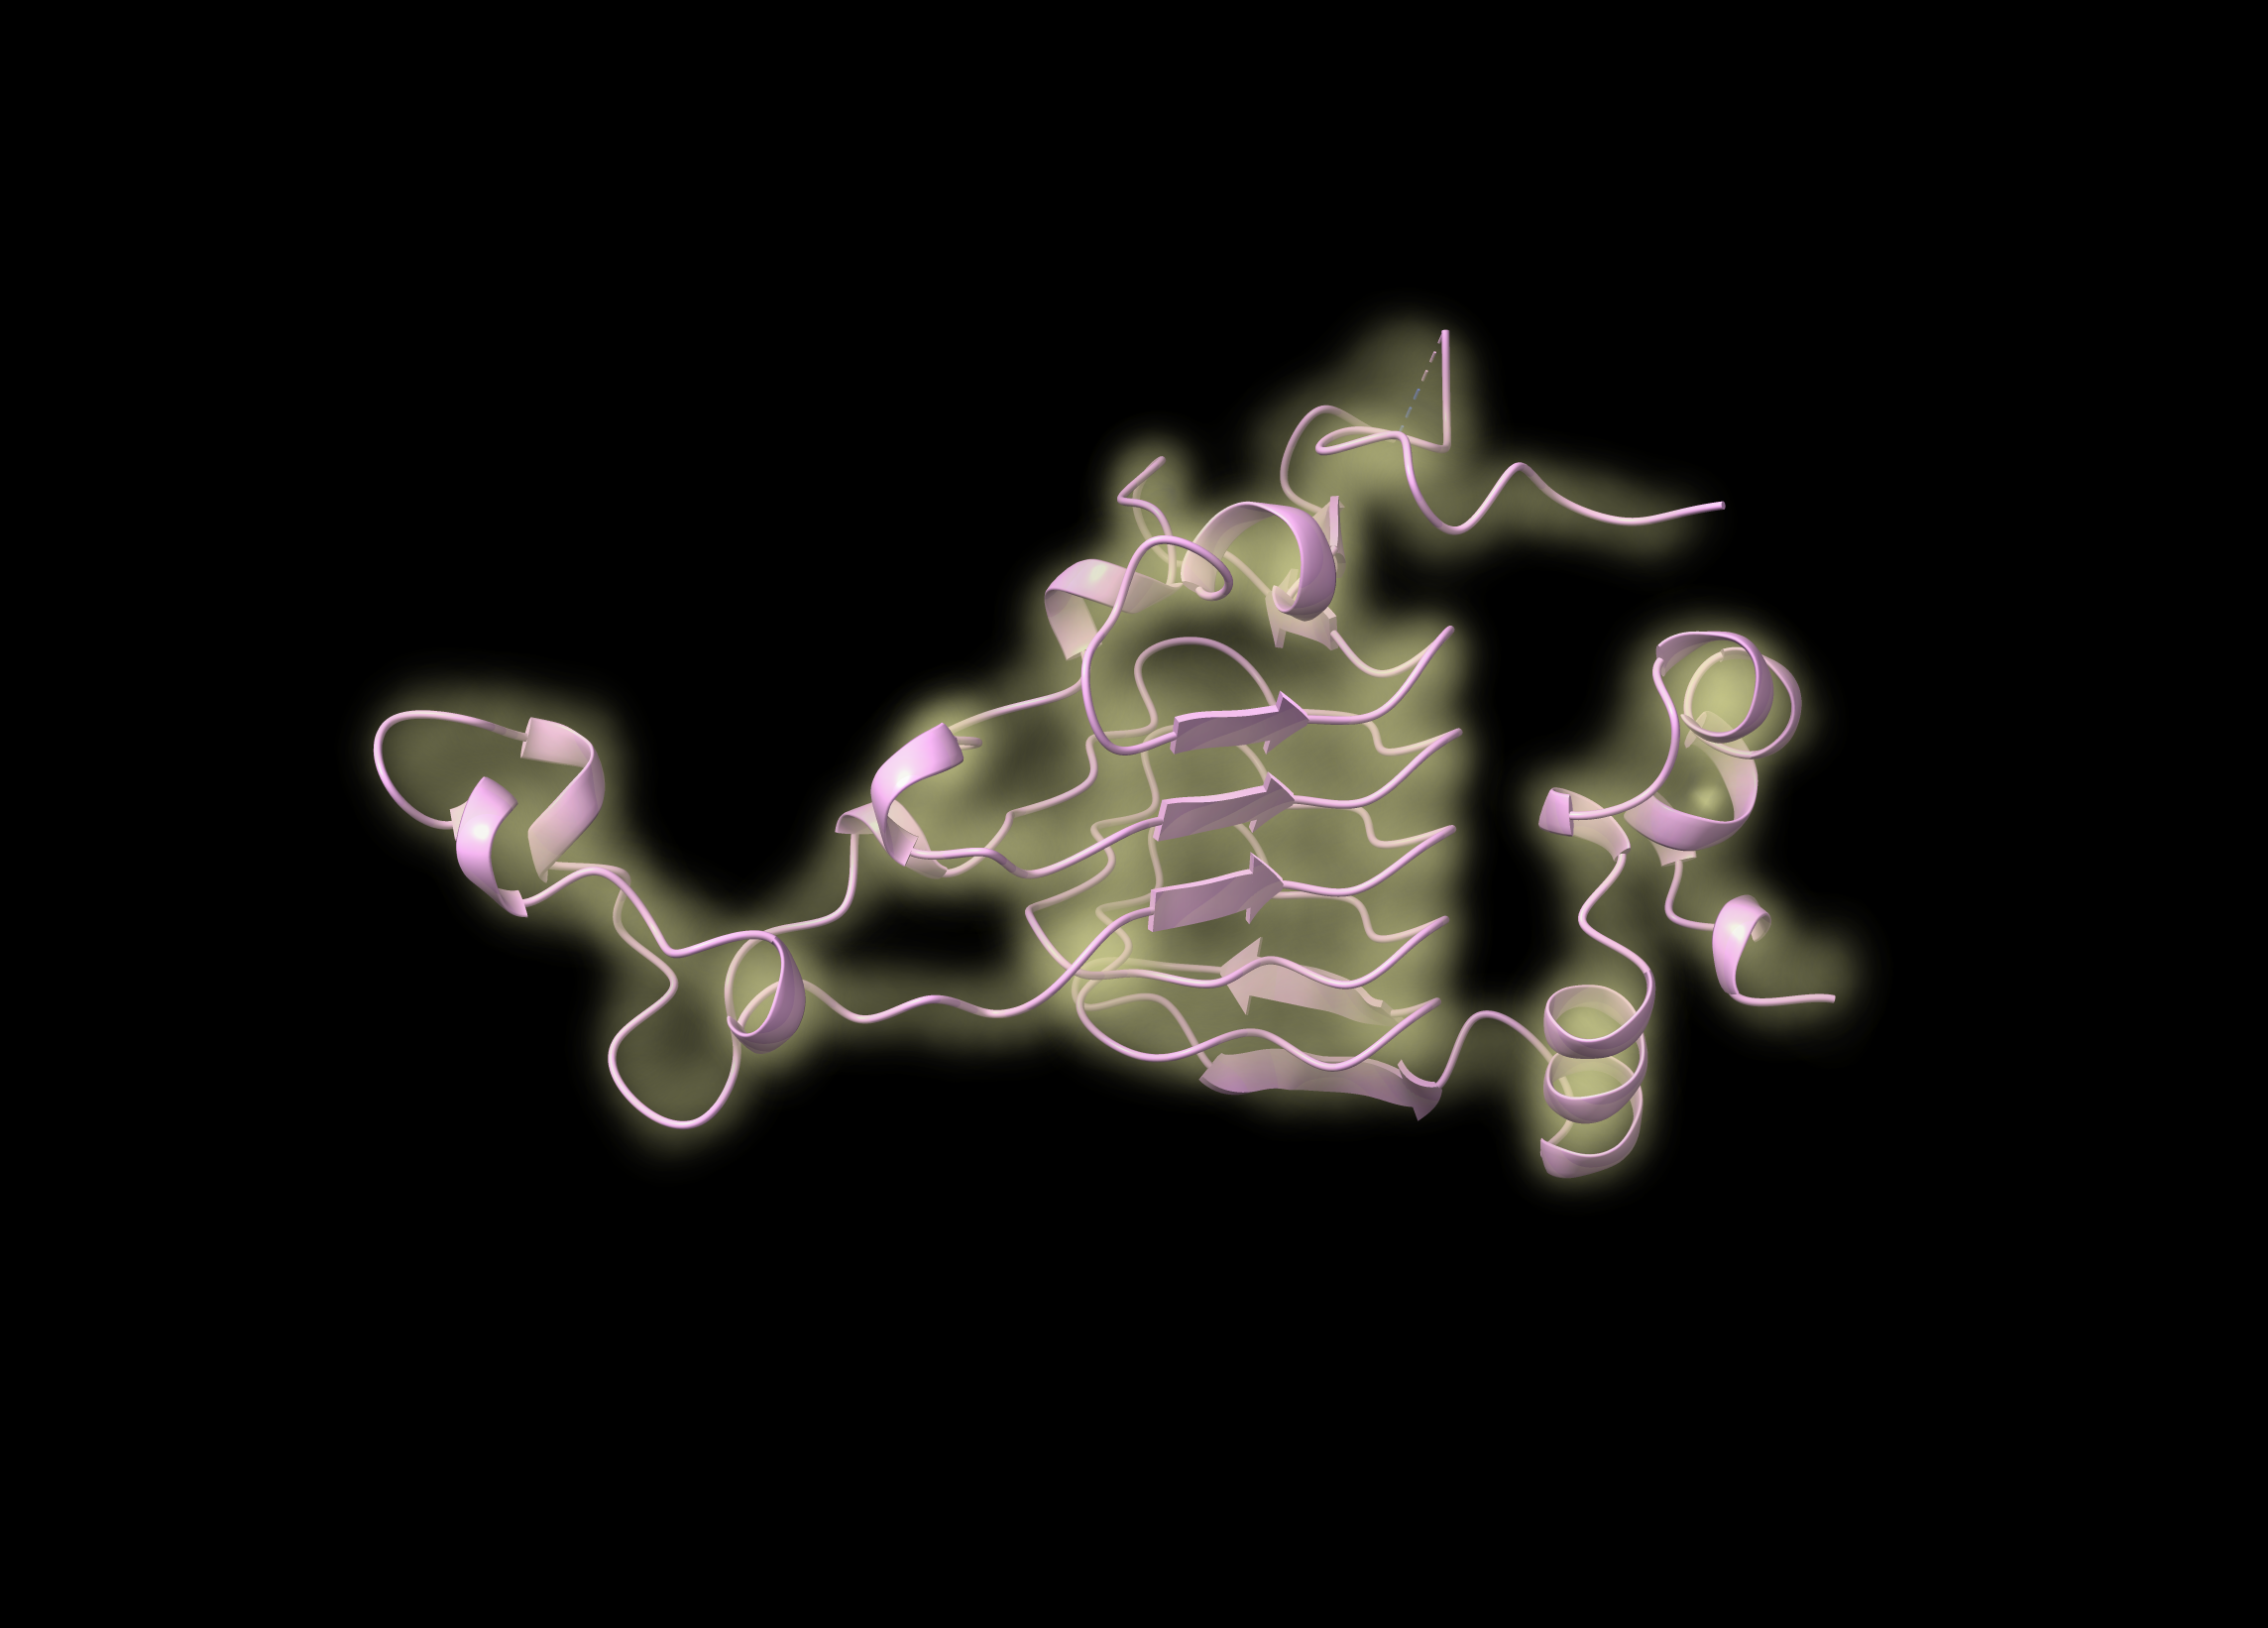
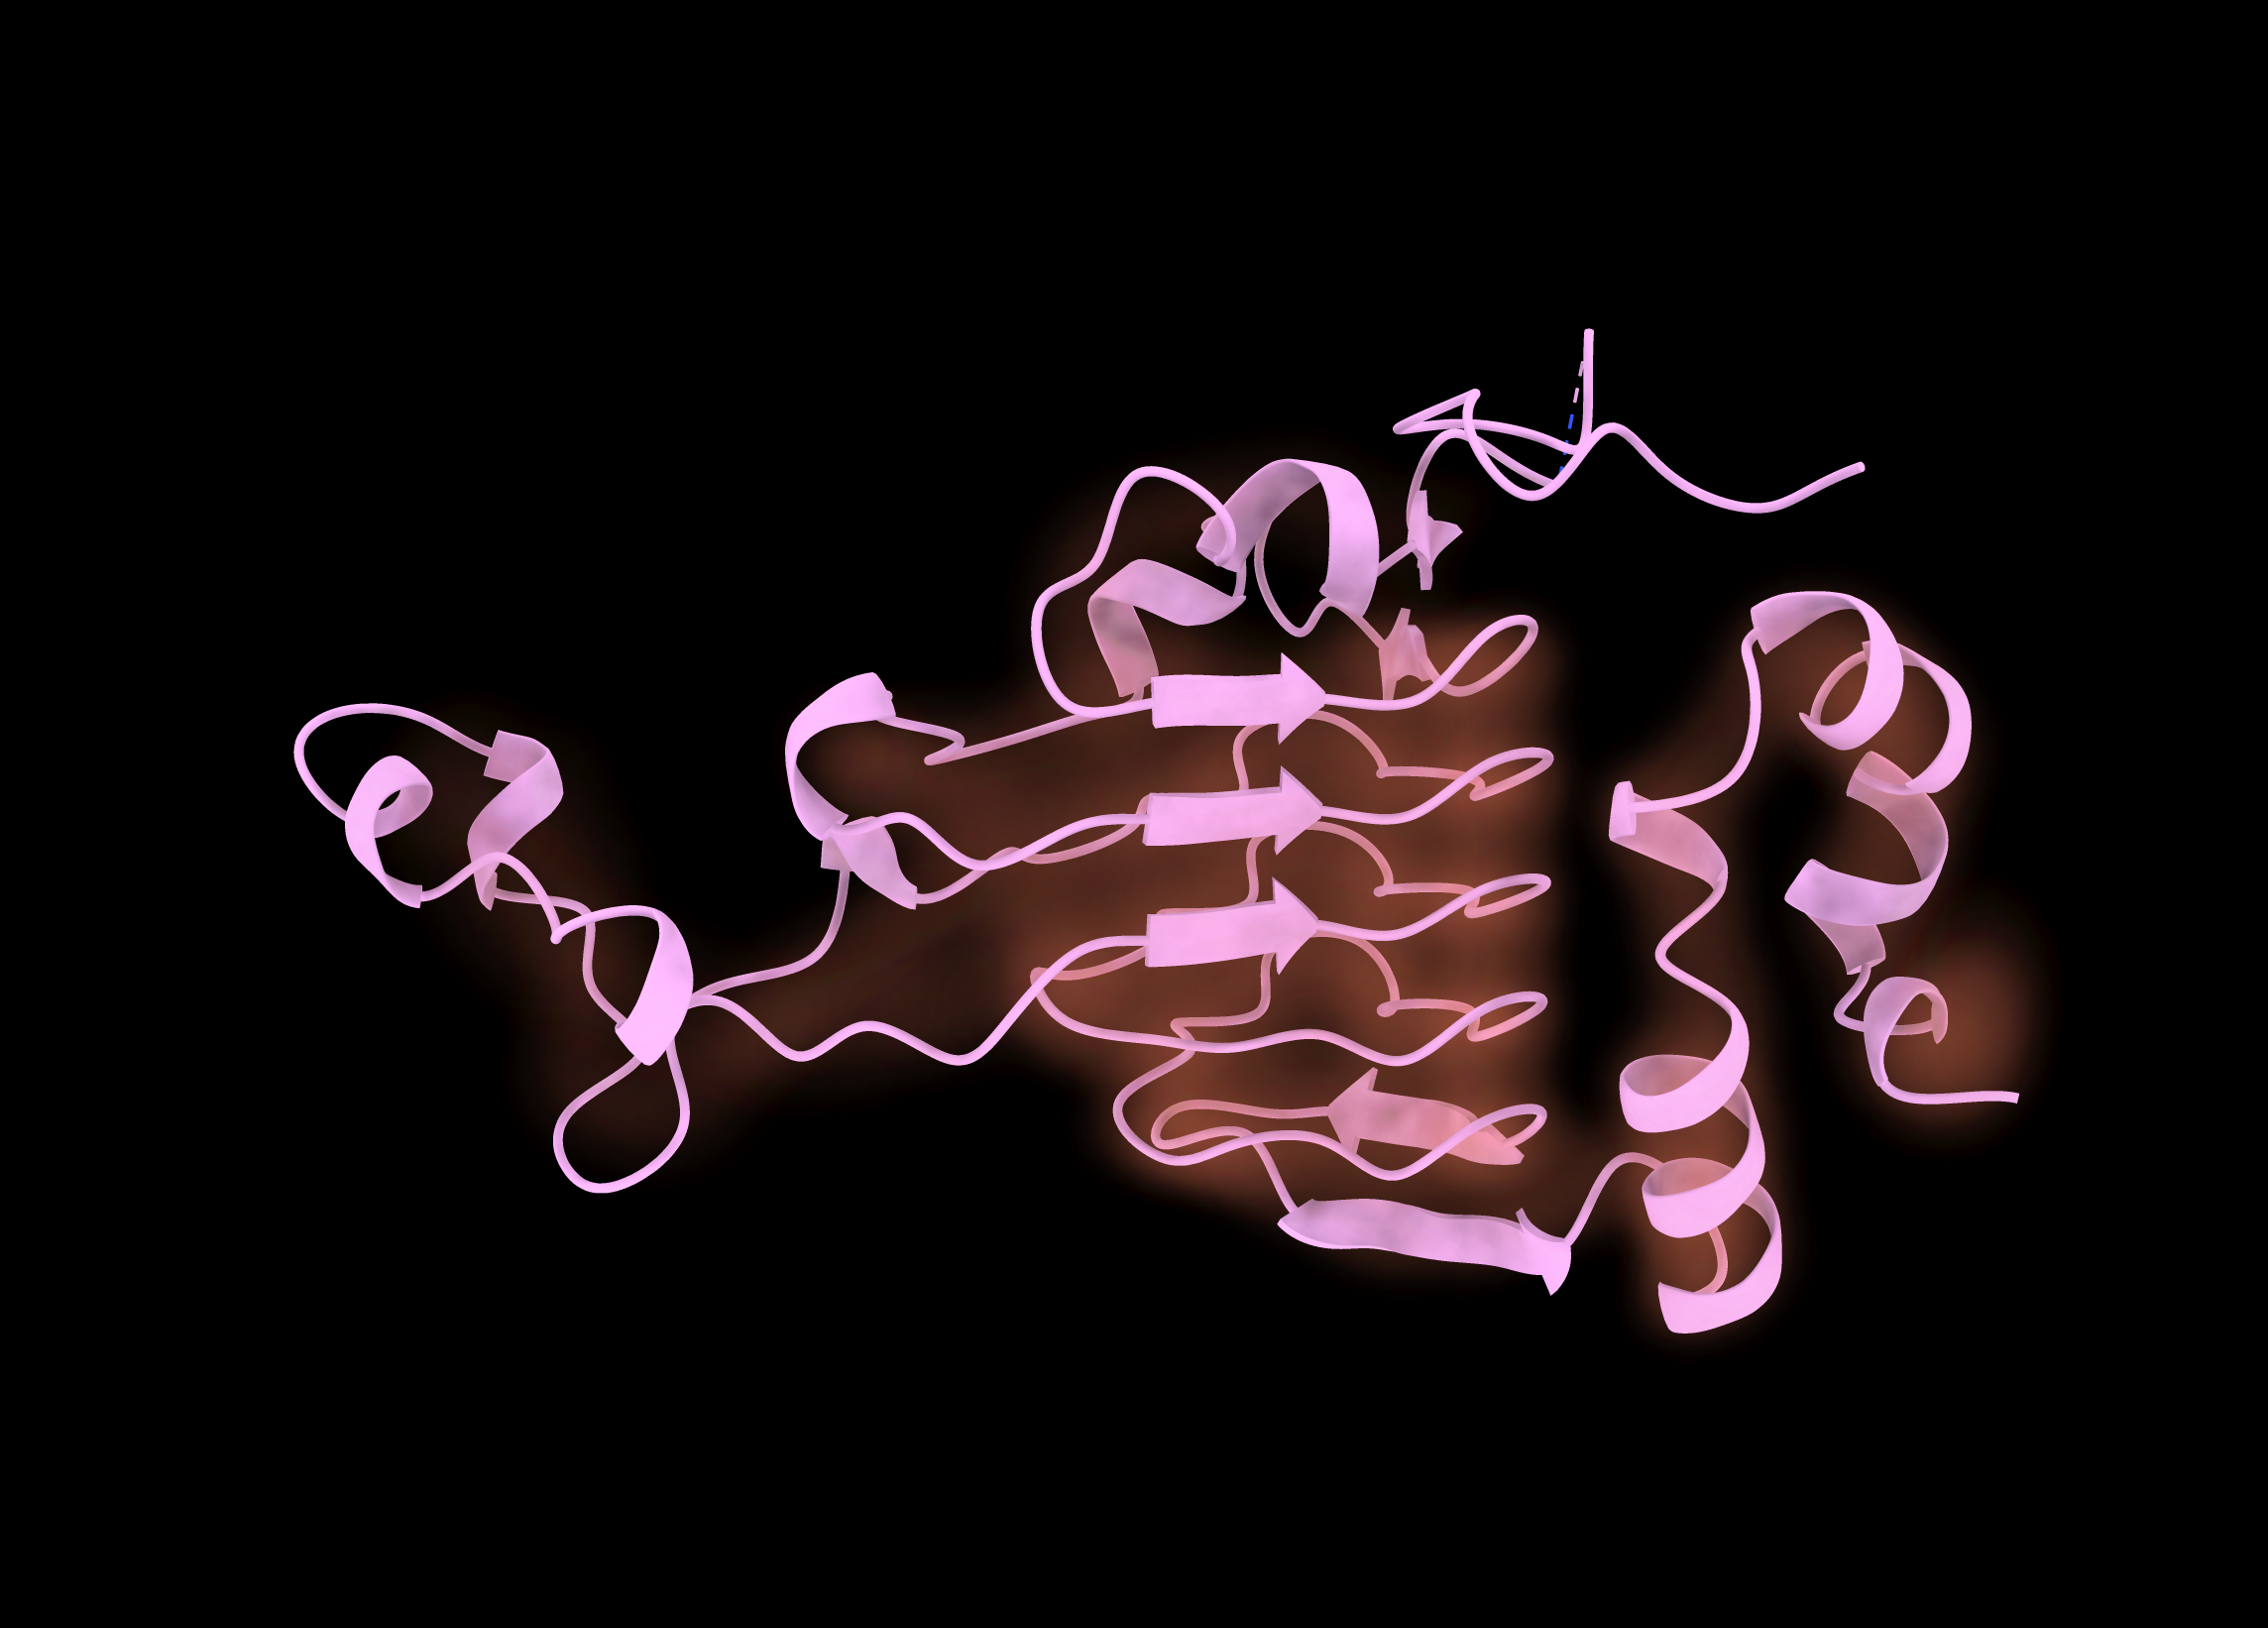
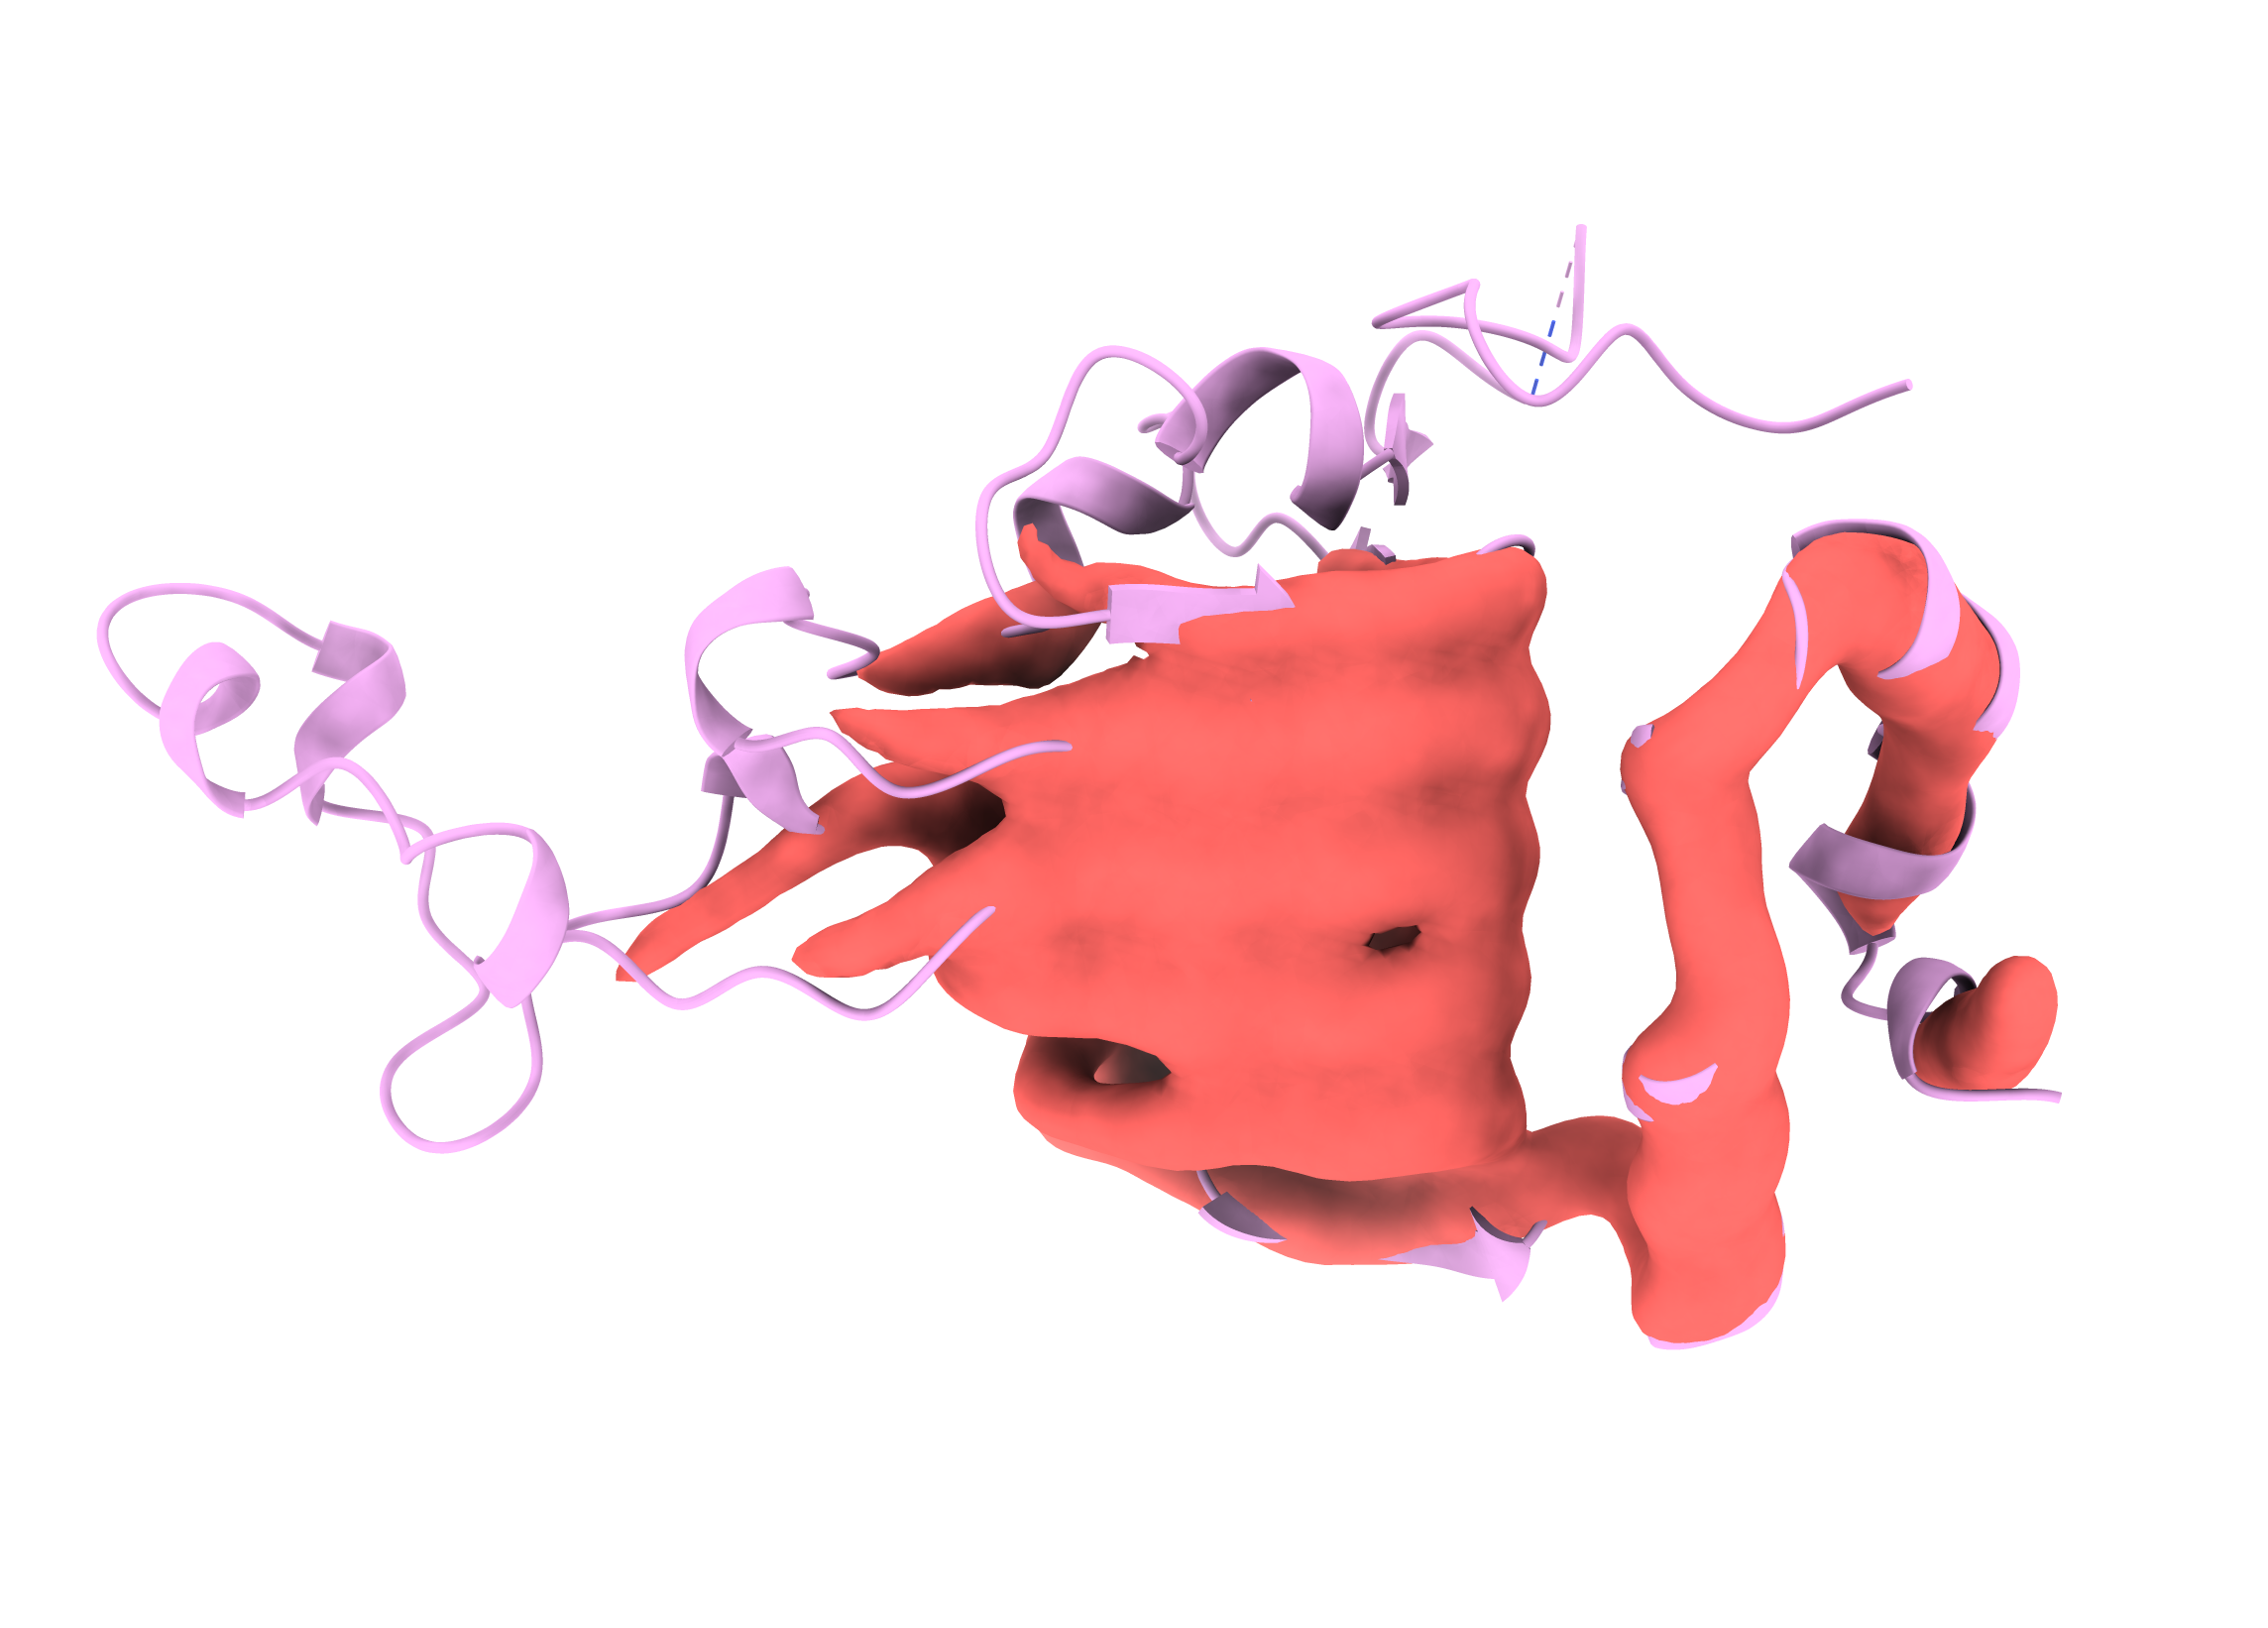
It’s hard to really see what is conserved and what isn’t. To get around this, we can generate psuedo-densities from an aligned set of structures: here, the “density” is essentially (proportional) to a probability density for the overall fold. I think this is sort of cool! It also turns out it’s pretty easy to do. Here’s a short script that will do it for you and a few other instructions.
First, align all your structures (duh). Then save them as a single combined PDB file. You can do this easily in PyMOL by choosing “File -> Export Structure -> Export Molecule,” changing the selection to “all” and saving as a PDB file. Make sure you’re writing all objects to one single file on the “Multi-File” tab.
Let’s say you saved this as “all_structures.pdb.” You can use the following script to generate a density map from this file in DX format. Install MDAnalysis with pip install MDAnalysis if you haven’t already. Save this as “generate_density.py” or whatever, and and invoke it (for example) with python generate_density.py -i all_structures.pdb -o density.dx. You can change the sampling density with the -d flag.
import argparse
import MDAnalysis as mda
import MDAnalysis.analysis.density

# read in args from command line using argparse
parser = argparse.ArgumentParser(description='This script will take a a pdb file and generate a pseduodensity map in dx format.')
parser.add_argument('-i', '--input', type=str, help='The input pdb file')
parser.add_argument('-o', '--output', type=str, help='The name of the output dx file')
parser.add_argument('-d', '--delta', type=float, help='The grid spacing for sampling PDB density (in Angstroms), default is 0.5', default=0.5)
parser.add_argument('--ca', '--CA', action='store_true', help='Use CA (backbone) atoms only')
args = parser.parse_args()

input_file = args.input
output_file = args.output
delta = args.delta

pdb_input = mda.Universe(input_file)
if args.ca:
    pdb_atoms = pdb_input.select_atoms('protein and backbone')
else:
    pdb_atoms = pdb_input.select_atoms('protein')

x = MDAnalysis.analysis.density.DensityAnalysis(pdb_atoms, delta=delta)
x.run()
x.density.convert_density(unit='Angstrom^{-3}')
x.density.export(output_file)
Use ChimeraX for the rest. Open the DX file as well as your reference structure. You’ll probably just see a bunch of dots for the map. That’s ok! Go to “Map -> Smooth” and you should see something a little more…mapish. The reference structure will also probably not be aligned with the map. ChimeraX can fit, but it seems to need a little help to start. Move the reference structure until it looks reasonably close, then use “Map -> Fit” to align them. You might need to fiddle but it should work.
Play with the gaussian surface levels to get a view of the density. Also try different map styles: image is sort of neat.


Surface is a bit clearer, if not quite as pretty.

Enjoy Reading This Article?
Here are some more articles you might like to read next: